Summary report
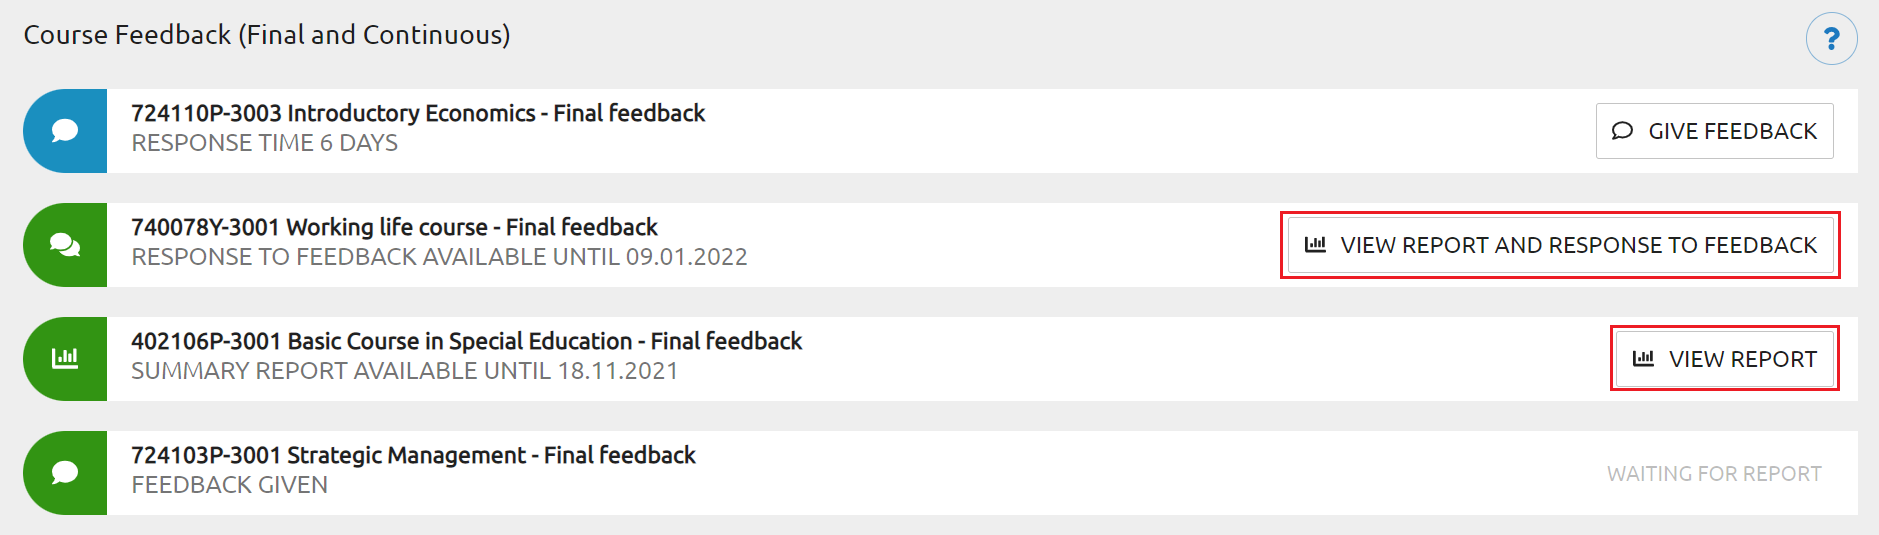
When the response time has ended you will automatically have the opportunity to read the summary report of the final feedback provided. You will see a summary report if there are at least three (3) answers given in total and if you have answered the final feedback questionnaire yourself. You can view the summary report by choosing VIEW REPORT or VIEW REPORT AND RESPONSE TO FEEDBACK on the data row of the course. The data row also shows you for how long the summary report is available for you. VIEW REPORT tells you that the summary report is available but the teacher hasn't yet responded to the feedback while VIEW REPORT AND RESPONSE TO FEEDBACK tells you that teacher has already responded to the feedback and counter-feedback is also available. (Picture 1)
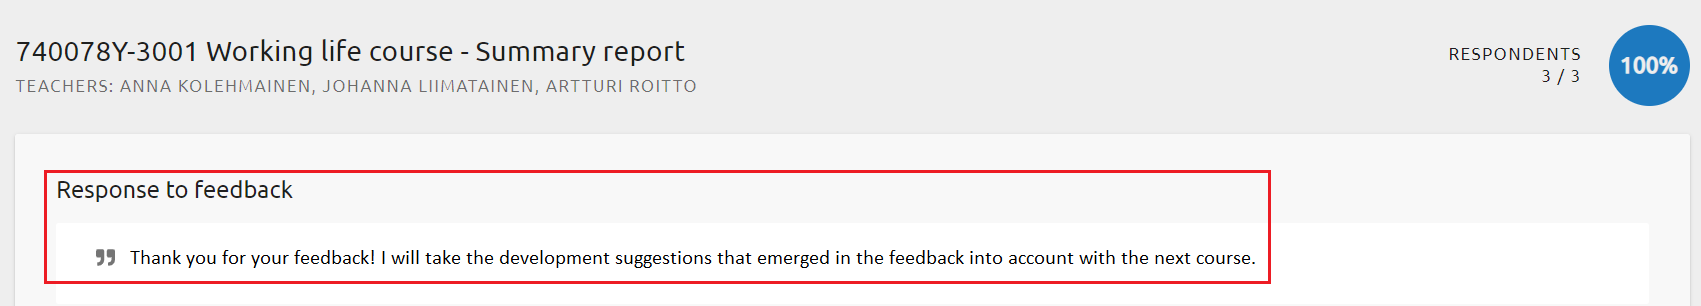
From the top right corner of the report, you can see the number of respondents and the response rate. (Picture 2)
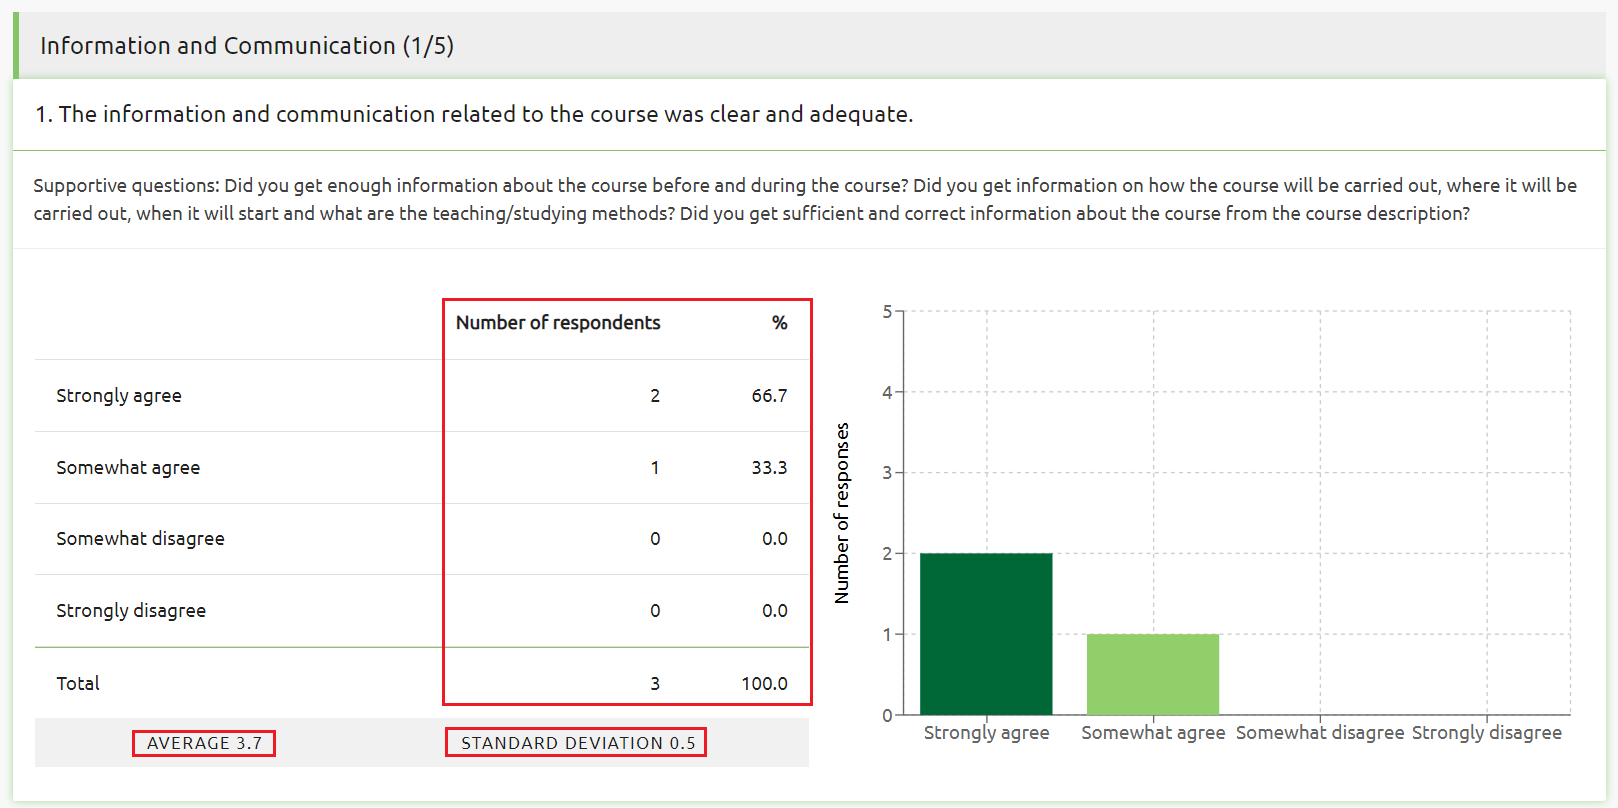
For each choice type of a question, you will see the number of respondents as well as the percentages by statement. In addition, you will see the average and standard deviation of the answers for each question. The answers are also presented as a bar chart. (Picture 3)
The summary report only includes averages of all answers given to choice type of a questions. Written feedback from students are never included in the summary report.
Counter-feedback
When the response time has ended, the teachers have 21 days to respond to the feedback received. You will be able to see the counter-feedback if you have answered the final feedback questionnaire yourself.
Once the teachers have written and published the feedback, you can read the feedback by choosing VIEW REPORT AND RESPONSE TO FEEDBACK on the data row of the course. (Picture 4) The data row also shows you for how long the counter-feedback is available for you.
You can see the response to the feedback written by the teacher(s) at the very beginning of the page before the summary report.
Picture 1: Show the report
Picture 2: Number of respondents and the response rate

Picture 3: Bar chart
Picture 4: Show the report and counter-feedback