SciVal is a paid analysis tool utilising the Scopus publication data. SciVal allows users to analyse and visualise publications from many different perspectives and using various indicators. The publication data in use contains Scopus content since 1996, and it is updated on a weekly basis. In practice, SciVal data is 1–2 weeks behind Scopus content.
Subjects of analysis
The central operational logic of SciVal is based on entities, i.e. the option to choose the subjects analysed at the time by using the selection panel on the left side of the tool. SciVal offers the following subjects as options:
- institutions and groups: organisation profiles recognised by the Scopus database are available
- countries, regions and pre-determined groups of countries (such as EU or G20 countries)
- topics and topic clusters
- publication channels indexed by Scopus
The users can also set objects for analysis:
- organisation groups (created by combining the existing organisation profiles)
- researchers created with the help of the Scopus researcher profiles
- research groups created by combining researcher profiles
- publication sets that can be created with the help of other entities or by importing them from the Scopus database, for example
- research areas that can be determined with a search term or by combining entities or existing research topics and topic clusters.
Modules
This guide introduces the four modules of SciVal in more detail. In addition to these, the modules Grants and Impact can also be purchased for an additional fee in SciVal.
In these different modules, you can review the publication data from different perspectives and, depending on the perspective chosen, they will provide different options for analysing and visualising data. The different modules also have their own limitations regarding which entities they can be used to review, which indicators can be used and what kind of time period limitations apply to the data.
Overview module

Figure 2. A screen capture of the summary view of the Overview module of the Scival analysis tool, in which the analysed subject includes the whole world, i.e. all the publications in the database from the time period selected. The figure only shows a small part of all the content available in the summary view. © Elsevier, https://scival.com, 7 April 2022.
The Overview module intended for reviewing the overall view of the entities facilitates the analysis of all the different entities. All SciVal indicators are available in the module, but their limiting factors are mostly predetermined. In the Overview module, users can choose to view a time period of three, five or ten years. Additionally, the results can be filtered by applying the ASJC classification of fields of science, for example. More information on this is available in the Scopus chapter.
Benchmarking module

Figure 3. A view of the Benchmarking module, on which three research groups have been created with the help of individual researcher profiles, for comparison through three different indicators. The global average is also presented for indicators on x and y axes. © Elsevier, https://scival.com, 7 April 2022.
The most versatile of the modules is Benchmarking, where all the different entities can be analyzed. Additionally, the module allows users to make use of all the available indicators, and they can also be specified by applying various filters. However, the most notable benefit of this module is the option to compare the subjects of analysis. Visualising the results is possible when applying three indicators simultaneously, but the table format allows users to use more than twenty indicators at a time. This module is also the only one that lets users determine the time period freely, from 1996 to the current day.
Collaboration module
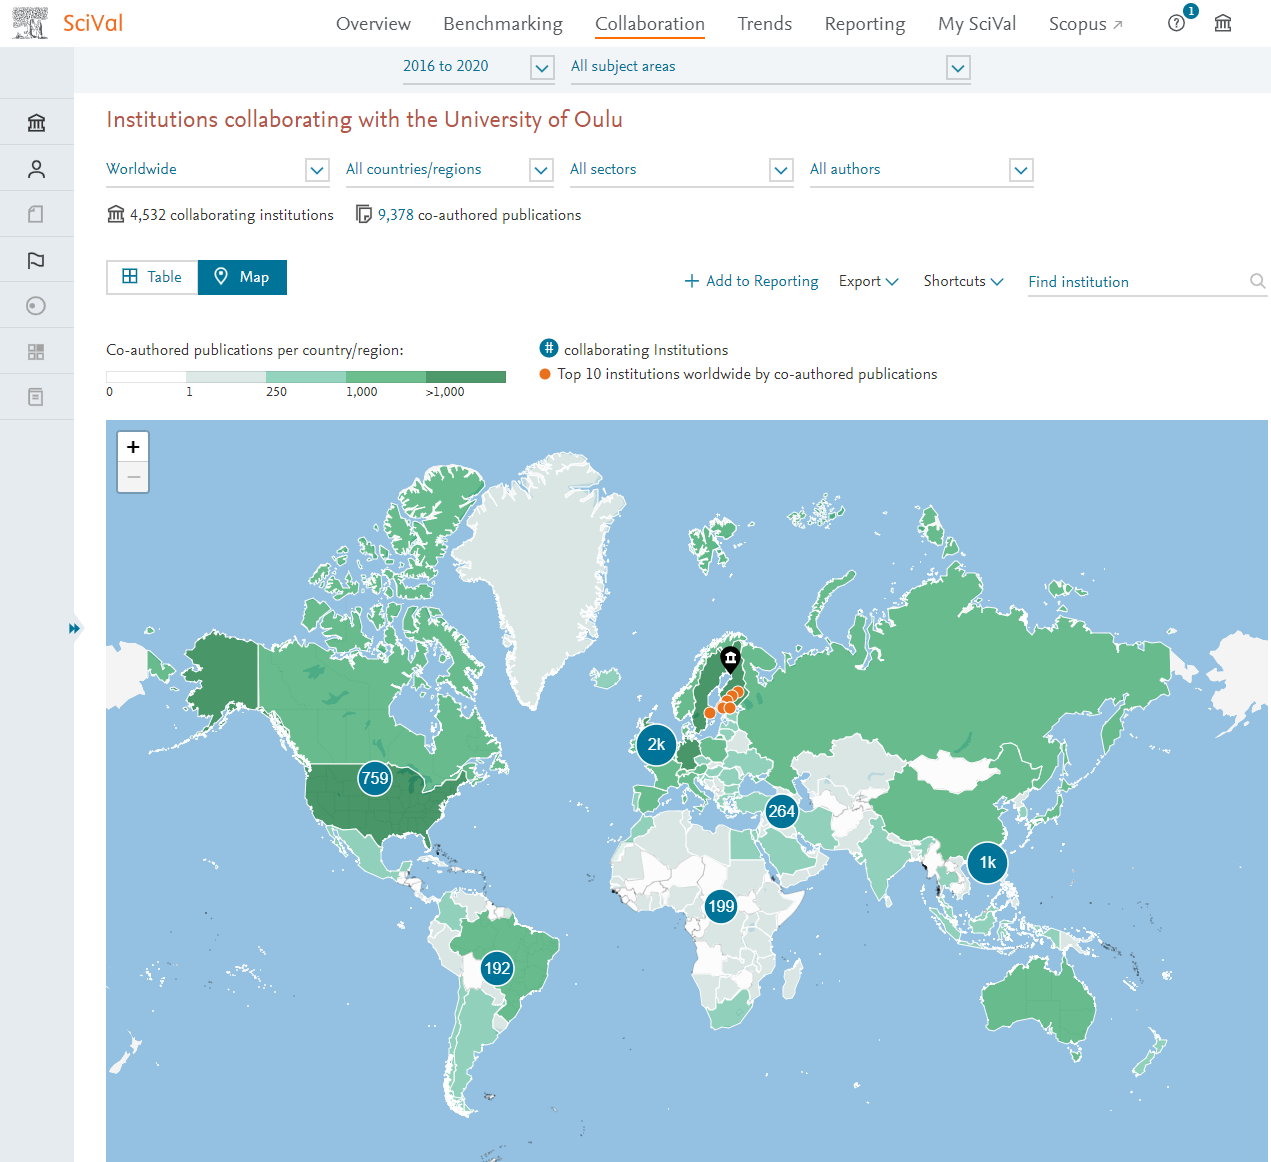
Figure 4. A view of the Collaboration module depicting the number of collaborating institutions the University of Oulu has on different continents. © Elsevier, https://scival.com, 7 April 2022.
The Collaboration module allows users to analyse the collaborating institutions of the selected organisation, country or researcher across the world and/or to look for new collaborators. The module can be used for producing a list of the research organisations on a certain continent that could become new collaborating institutions, among other functions. Collaboration can be viewed based on certain selected indicators, such as the number of co-publications and their impact based on the citation impact indicators. The module also allows users to review which individual researchers have taken part in the collaboration with the organisation in question. In the Collaboration module, user can choose a time period of three, five or ten years.
Trends module

Figure 5. A view of the Trends module and its Institutions tab as a visual version. In practice, this figure shows an example set of publications, indicating which European organisations are present in the publication set and how high their average citation impact is based on the publications in the set. © Elsevier, https://scival.com, 7 April 2022.
The Trends module allows users to analyse research areas or publication sets formed in different ways. The set to be analysed can be imported from Scopus or it can be created using a search strings in Scival. The module also allows users to examine topics and topic clusters created by an algorithm. The module can be used to analyse the reviewed set of publications to see which countries, organisations and researchers are the most active in the research area in question and which publication channels are the most used. There are several different indicators available for each of these for factors such as collaboration, number of times viewed, citation impact and funding granted. In the Trends module, the user can choose to view a time period of three, five or ten years.
Other sections accompanying the modules
In addition to the modules introduced above, SciVal has a Reporting section that facilitates reporting by offering functionalities for creating repetitive reports. In practice, a once planned and implemented analysis can be easily repeated, for example, to examine the same entity regularly over a longer period. Another purpose of using the reporting section is to produce a similar analysis for several different objects using the same reporting template for all of them.
My SciVal section, on the other hand, allows the user to manage the entities used. This section also allows users to create research groups based on individual researcher profiles or organisation groups based on organisation profiles, for example. The section can also be used for sharing entities created by the user with the other SciVal users in their organisation.
Indicators

Figure 1. A view of the SciVal analysis tool’s indicator menu in the Benchmarking module © Elsevier, https://scival.com, 7 April 2022.
SciVal offers an extensive selection of indicators, which are available with different filtering options depending on the module. The Benchmarking module has the most versatile set of indicators. A varying number of indicators are available for different perspectives:
- The collaboration metric contains indicators that describe the number and proportion of publications written in different forms of collaboration.
- Under the Published metric, the users can analyse the subject reviewed from the perspective of the publication counts, for example, while considering the different types of publications and the author role of an individual researcher in a publication.
- The Viewed metric offers indicators that depict the viewer counts of the subject reviewed. These also include field-normalised indicators. The viewer numbers are counted based on the views of abstracts in Scopus or clicks on links to the publisher's article page.
- The Cited metric features 15 different indicators based on citations, including Field-weighted citation impact and Outputs in top citation percentiles indicators
- The Economic Impact metric offers indicators describing corporate collaboration as well as indicators based on patents.
- The Societal Impact metric includes indicators reflecting mentions in the media.
- The Topic Indicators include only the prominence percentile indicator, indicating the momentum of the research topics or topic clusters. Calculation of the indicator combines citation count, views count and the average CiteScore metrics. This indicator can only be used for analysing research topics that have already been calculated by SciVal.
- The Awarded Grants metric include the funding indicator, which can be viewed either by the count or value of awarded grants. However, this calculation only includes the major international funders and excludes the data of funding received from Finnish funders, for example.
This guide’s chapter on indicators has more information on the individual key indicators. SciVal also offers users a separate Research Metrics Guidebook that describes the functions of all available indicators.
Classification of fields of science and research topics produced with the help of citation analysis
The default classification applied in the SciVal analysis tool is Elsevier’s own All Science Journal Classification (ASJC), which is also used by Scopus. More details of this classification can be found on Scopus page’s section on classification of fields of science. In addition to the default classification, SciVal allows the use of six other international classifications: Field of Research (FoR), Fields of Research and Development (FORD) Classification, Database of Grants-in-Aid for Scientific Research (KAKEN), REF 2014, Quacquarelli Symonds Classification (QS) and Times Higher Education Classification (THE).
All the classifications mentioned above can be used for filtering the analyses so that they only apply to the selected class of publications within the selected classification. In such cases, the selection only affects the number of publications selected, not the calculation of field-normalised indicators.
SciVal’s own support site includes more comprehensive data on the field of science classifications applied in the tool and how to use them. You can read more about the field classifications in general as well as their significance in publication metrics in the chapter Differences between fields of science.

Figure 6. An example of examining an entity through research topics identified for it in the ‘Wheel of Science’ view. Each of the bubbles describes an individual research topic; the size of the bubble reflects the number of publications, the colour the key ASJC classification and the location allows users to identify multidisciplinary topics. © Elsevier, https://scival.com, 7 April 2022.
The SciVal tool also offers the option to examine areas of research with the help of topics produced through citation analysis. The annually repeated calculation has now identified about 96,000 topics, which together make up about 1,500 more extensive topic clusters. After indexing the database, each individual publication is clustered in a suitable topic with the help of an algorithm. At this stage, the process of finding a suitable topic is based on the reference list of the publication in question. However, the topic of each individual publication may also change later, as the citations received by the publication will also narrow down the identification of the right topic. Each individual publication can belong to only one research topic and thus also to only one cluster of topics. These topics and topic clusters can be viewed based on all entities, such as research organisations, countries, individual researchers or research groups.
The topics and topic clusters linked to each entity can be viewed in many different ways, such as in a table, a wheel of science (Figure 6) and as a scatter chart. The individual topics and clusters can also be viewed in the Trends module which allows users to identify the most productive researchers and organisations on different topics, for example.
This subject has been covered in more detail in SciVal’s Topic Prominence of Science guide.
Limitations of the tool
Similar to Scopus, the key limitation of using SciVal is its availability, as SciVal is a paid service.
SciVal's data also causes several limitations, which are based on the limitations of the Scopus database, which is the source of the data. You can read more about these in the section presenting the limitations of Scopus in this guide. It should also be noted that SciVal only includes publications starting from 1996 of all the data in the Scopus database.
There are several technical limitations, most of them due to the method applied to make using SciVal faster. This has required the pre-calculation of all combinations for all the entities. Due to this, entities determined by the user that have more than 5,000 publications also need to undergo a daily calculation, and it may take a maximum of six hours to get them into use. Additionally, entities determined by the user and containing more than 200,000 publications cannot be produced at all.
SciVal’s method of field-normalisation can also be considered a limitation, because it is based on the classification of publication channels. This means that an individual article is considered to belong to the scientific field or fields to which its publication channel has been determined to belong. Normalising has been described in more detail in this guide’s chapter on methodological points of view.
The methods used for counting the indicators also partly deviate from those applied most commonly. The clearest example of this is the calculation method for Outputs in Top Citation Percentiles indicator, where the Field-weighted Citation Impact values of the publications are used for determining the limit values of the percentiles instead of their number of citations. This topic has been discussed in more detail in an article by The Bibliomagician blog (Leino & Gauffriau, 2020). The duration of the citation time window is another factor that cannot be changed when counting normalised indicators: by default, it is the year of publication and the three following years.
Sources
Elsevier (no date) SciVal Support Center. Available: https://service.elsevier.com/app/home/supporthub/scival/ [Accessed 7.4.2022]
Elsevier (no date) Research Metrics Guidebook. Available: https://www.elsevier.com/research-intelligence/resource-library/research-metrics-guidebook [Accessed 7.4.2022]
Gauffriau, M. and Leino, Y. (2020) Guest Post: Understanding SciVal’s calculation of field-weighted percentile indicators. The Bibliomagician. Available: https://thebibliomagician.wordpress.com/2020/10/15/guest-post-understanding-scivals-calculation-of-field-weighted-percentile-indicators/ [Accessed 10.5.2022]