Osallistuja CSC:ltä: Heini Manninen, kehityspäällikkö, Tiedon hyödyntämisen ratkaisut koulutukselle
Tapahtuman agenda
Heini Mannisen esitys
Alla Mannisen muistiinpanot kahden päivän seminaarista.
Make data smart - a road map to the next level
3rd Feb 2020
13.00-13.10: Introduction by Bene Lamote, Host and BI Manager, University of Ghent and Gry Jordet Kibsgaard, BI SIG leader, EUNIS and BI Manager Norwegian University of Science and Technology
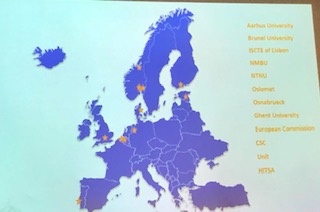
Organizations present in the seminar today:
13.10-14.00: eCorda data: sharing data with HE-institutions
Roberta Pattono, European Commission, DG Research & Innovation, Directorate B_Common Implementation Centre, Unit AB6 –Common Data and Knowledge Management Service
- How we share data on EU funding research projects
- Horizon data
- Data can matter and have an impact on your life
- Data - Information - Knowledge -> Wisdom
- One-stop-shop for EU Research Programme data: Horizon dashboard (EU research programmes)
- Target audience: general public, EU member states and associate countries
- Horizon Dashboard: mobile friendly, serach, many visuals etc.
- Listening users, doing surveys to develop dashboard, working in close cooperation with member countries
- Dashboard has also thematic topics
- Aggregated data, due to privacy matters cannot drill down as much as one would sometimes need to
- Country profiles: quick or detailed overview on your countrys profile
- KPIs and detailed figures per country or region
- Comparisons witk other countries
- etc.
- Miten tämä suhtautuu meillä tehtyyn Horizon visualisointin?
- CORDIS
- EU Open Data Portal
- Acces to European Union Open data
- Look for Developers corner → API
- Whats next?
- Horizon 2020 Participation and Research Collaboration (now available only for eCORDA users)
- data Geo-location
- research departments data
- projects for collaborations between countries
- data quality enhancements on results
- horizon Results platform data
- Organizational profiles
- R&I Data Hub
- Beyond data
- What do we do aside data
- enhance the research results uptake through dedicated services for beneficiaries → how results have made impact on EU citizens life
- Way to better communicate and show value
- enhance the research results uptake through dedicated services for beneficiaries → how results have made impact on EU citizens life
- What do we do aside data
Discussion:
- About eCORDA API, what can and should be available
- Flat sheets mean now a lot of manual data (since not all the data is available through API)
14.10-15.30: National cases of sharing HEI-data: opportunities and challenges
- CSC experiences on sharing HEI data in Finland by Heini Manninen, Development Manager, Services for Education, IT Center for Science Ltd. (CSC)
- UGI (Ghent University Business Intelligence Platform) for education: applying and sharing data with national database by Maya Caen, University of Ghent
- BI Platform
- Education policy and quality assurance
- Web portal for experts
- Data downloadable
- Interactive
- "Very complex"
- Dashboards environment (Own application Diver-tool (Dimensional insights))
- To manage data better, "less complex" than portal
- Integration of reports in SharePoint
- All three are linked, you can dig deeper from dashboards to portal
- Hard part was to get right definitions and rules, to get into "single point of truth"
- Termien määritelmät on linkattu, avatutuvat suoraan sivulle erilliseen ikkunaan
- Differences between faculties, courses etc. Different aggregate levels: Institutional level, local levels, individual levels...
- Opportunities: To link student data also beyond graduation degrees, to career / job market.
- Metadata is important, important to all parties to get together
- UGentissa myös ajatuksena trackata oppilaita pidemmän päälle myös työpaikkojen suhteen, eli saada koko datasetti käyttöön
- BI Platform
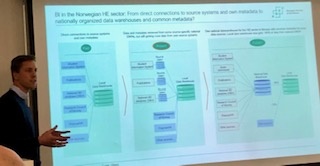
A national infrastructure for HEI data in the making: Unit and NMBU’s experience so far
Ole Martin Nodenes, Head of Data analysis and decision support, Directorate for ICT and joint services in higher education and research Norway (UNIT) and Kasper Thoring, BI manager, Norwegian University of Life Sciences (NMBU)
Ole Martin Nodenes
- Servicing for 21 state universities and some private institutions
- HEIs in Norway are autonomous, competitors, collaborations
- 6 HEIs have their own BI solutions
- No master data management for the sector
- Joint DW project
- Pre project in autumn 2019
- Object:
- reduce resources used for ETL, data prep, cleaning....
- joint solution for all
- joint management of information security and access management
- benchmarking
- joint KPIs
- facilitate joint reporting to Ministry and other public sector organizations
- Test in the cloud is coming up - have to decide cloud or prem?
Kasper Thoring
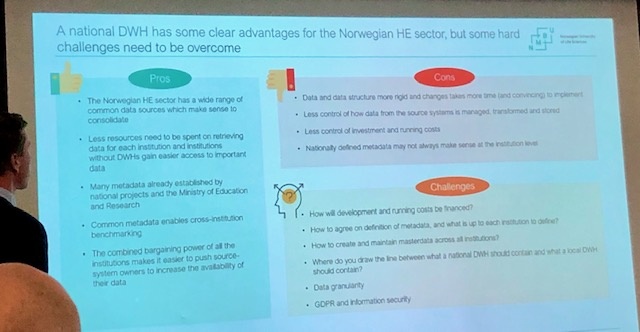
- Aiming for one national data warehousefor the HEI sector
- National DW 90 % of alla data, and 10 % for HEI own sources
Pros outweight cons, but there are challenges:
15.45-16.30: Discussion on how to make data smart by using national HEI infrastructures facilitated by Pekka Kahkipuro
- What are the goals for the work (a) for the institutions and (b) nationally
- How to get from "dumb data" (reporting) to next level → "smart data" and wisdom?
- Division of work between regulatory bodies, HE institutions, and infrastructure service providers
- Should there be a reference architecture, such as in mobile operator sector?
- Should there be a common architecture?
- Key success factors (based on the three national cases and participants’ experiences)
- Has to be actionable
- HEI Rankings - HEIs should define themselves how rankings are done. Now outside companies are doing rankings by their own definitions.
- Discussion about reference architecture
- Maturity of users: ability to use and be critical towards data, and be able to put it into context
- Also tools should be usable
- "Use data smart", "use tehcnical tools smart"
- Discussion on data literacy, tool literacy, analytics literacy, also on ability to use digital tools, even websites
17.00-17.30: BI SIG activity: signing up to the team! Official opening of the BI SIG Teams by Gry Jordet Kibsgaard
4th Feb 2020
08.30-09.00: BI SIG teams: how to use it and thrive from sharing our knowledgeby
Gry Jordet Kibsgaard
09.00-09.45: The maturity assessment model for HEI in the making
Elsa Cardoso, University Institute of Lisbon, Portugal & Xiaomeng Su, Norwegian University for Science and Technology, Norway
- Maturity Model = set of dimensions, sequence of levels
- Self assesment tool
Recommendations and NBO/NBA for HEI students → mitä CSC:llä voisimme tehdä tämän suhteen?
2013 BI Maturity Survey
- 9 countries, Suomi myös mukana
- Mosty public HEIs
- Lack of understanding of BI key concepts
- 2019 revitalization of the BI SIG
- On the background a MM model for a specific hospital in Italy
- Why this model? self assessment experience
- open access, free for everyone to use
- lean approach (simple, not too complex..)
- capturing new dimensiosn (analytics, IoT, 5G...)
- What MM brings to the HEIs:
- HEI can understand the critical BI succes factors for themselves
- Experiemces and feedback from Trondheim seminar (spring 2019):
- Lot of discussions about cloud computing
- How to represent the presence in between two levels?
- you should select the lower maturity level until you are totally up to the higher level (all criteria is fulfilled)
- Is it always needed to aim to the last upmost level?
- Situation now:
- version 1.0 of the maturity model in validation
- case studies done
- Whats next...?
- Set of recommendations?
- Go live next?
- Pekka Kahkipuro: We should have a project / action plan how to improve, what to do next. MM could have this as well (what HEI could do next after doing the maturity model)
09.45-10.15: Finished case studies (NTNU and NMBU) present their results and experiences
Kasper Thoring (NMBU)
- The Maturity Assessment Model process - how they did it in NMBU
- Pitäisikö CSC:n tehdä oma malli jollain tasolla? Harjoitus RAISE-tiimissä?
- Onko CSC:llä somekanavien / somen seurantaa talotasolla?
Gry Jordet Kibsgaard (NTNU)
- Using IBM analytics and Cognos
- Crossfunctional team
- Also "Work process designers" and training on service design
- Maturity Model assessment from NTNUs Technical development team & Product owners and user representative:
Insights:
- These two teams have to be mixed, and get talking to each other
- Need to be more agile, now starting scrum of scrums → 4 scrum teams