EUNIS Learning analytics workshop, Helsinki
Participants:
More than 70 participants
Almost 40 oraganizations
10 different countries
CSC participants: Kaisa Kotomäki, Antti Mäki, Outi Tasala, Lara Anastasiou
Social media: #EUNIS
Recording:
(to be added)
Program and notes Thursday 11.10.2018
Welcome
EUNIS, Gill Ferrell (JISC)
- It's all about community and sharing experiences with EUNIS
- Improving the student learning experience is at the core of it all
Aalto University, Christa Winqvist (Aalto University)
- Aalto is aiming to be a data driven university
- "Aalto analytics", not just learning analytics, but data that can support the whole Aalto University in teaching, learning and management
- "Be the game changers and have fun." Oppiminen/opettaminen ei ole muuttunut, mutta aika on. Tulevaisuus tuo uusia mahdollisuuksia analytiikan avulla.
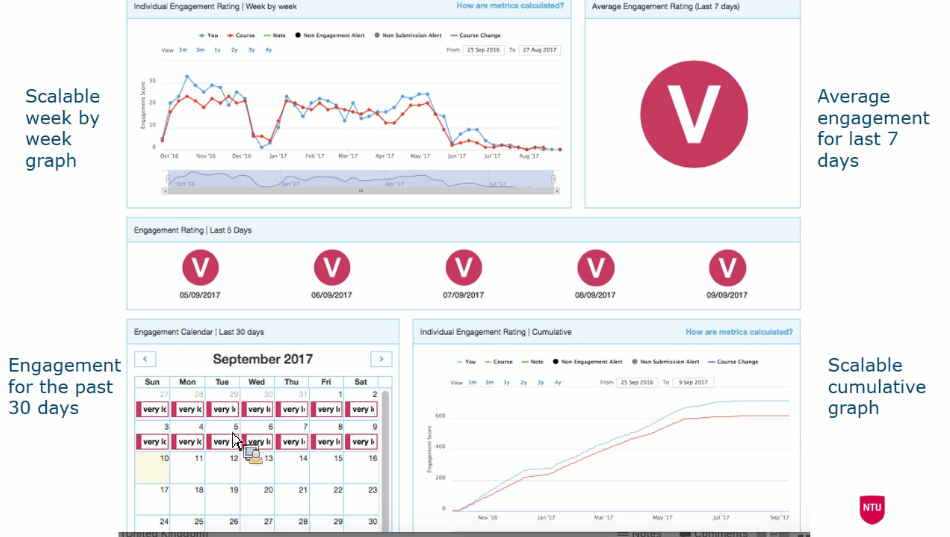
Supporting students via learning analytics: the NTU student dashboard
/ Jelena Matic, VP Education, Student Academic Experience Officer, Nottingham Trent University (student union)
- Listening to students' voices in the UK universities very important, strong student union
- Student union have been a part of the development of the student dashboard from the beginning
- If students are involved in the development they are much more likely to use the tool in the future
- Trent Institute for Learning and Teaching, TILT, works on collaborative learning
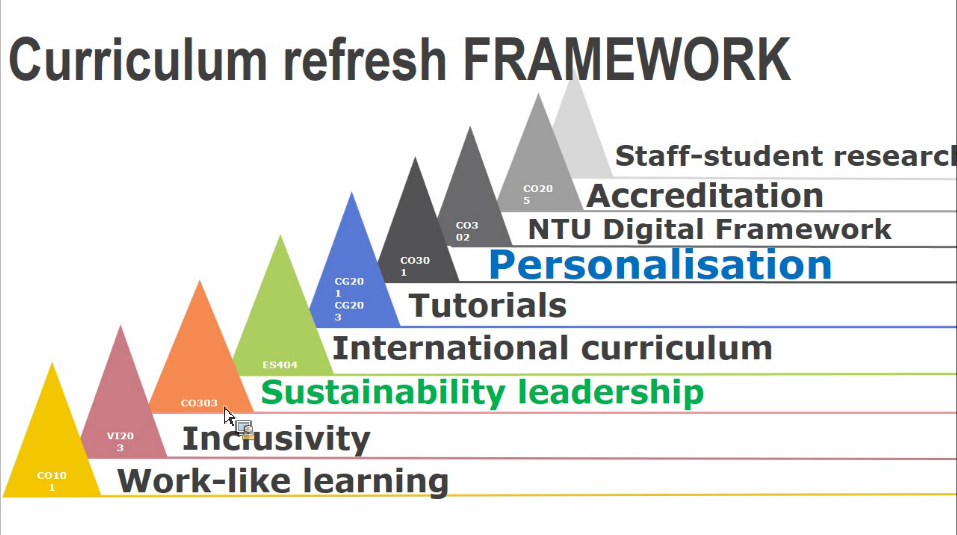
- Every course had to go through the curriculum refresh framework (see picture below)
- Success for all - Tackling different attainent: important part of the university strategy
- Student dashboard pilot in 2013-14 and implementation 2014–2015, now ~30000 students and 2500 staff members use the dashboard
- Not for evaluating failure risk, but focuses on engagement.
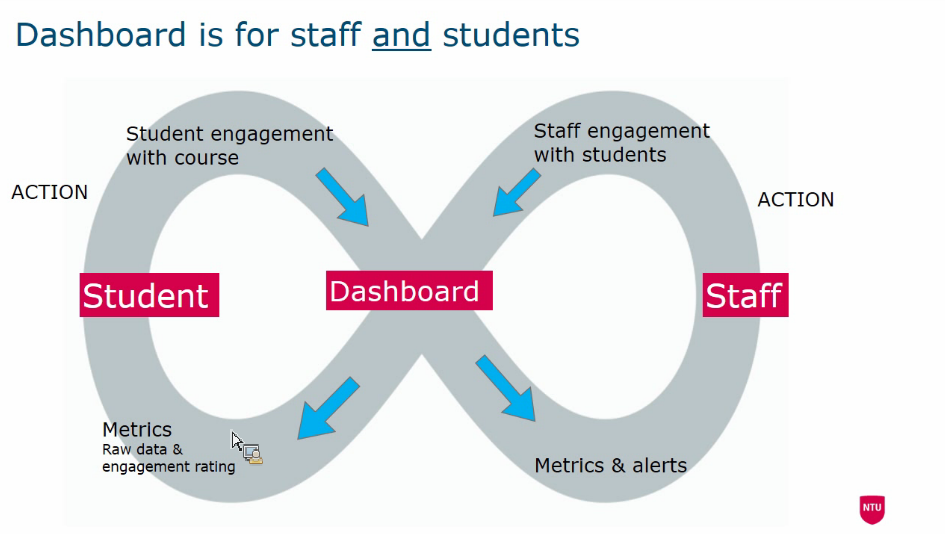
- Not for evaluating failure risk, but focuses on engagement.
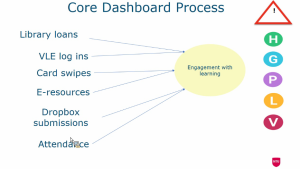
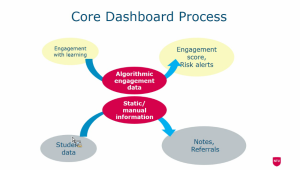
- Core Dashboard Process
- Collecting data to analyze learning engagement
- Attendance monitoring using mostly QR codes
- New students as guinea pigs

- 64% of the students find the dashboard useful. Students their self want to get the information about if they are in risk of drop our and what they can do no prevent it.
- New students as guinea pigs
Screenshots of the presentation:
Student view:

Challenges of using learning analytics:

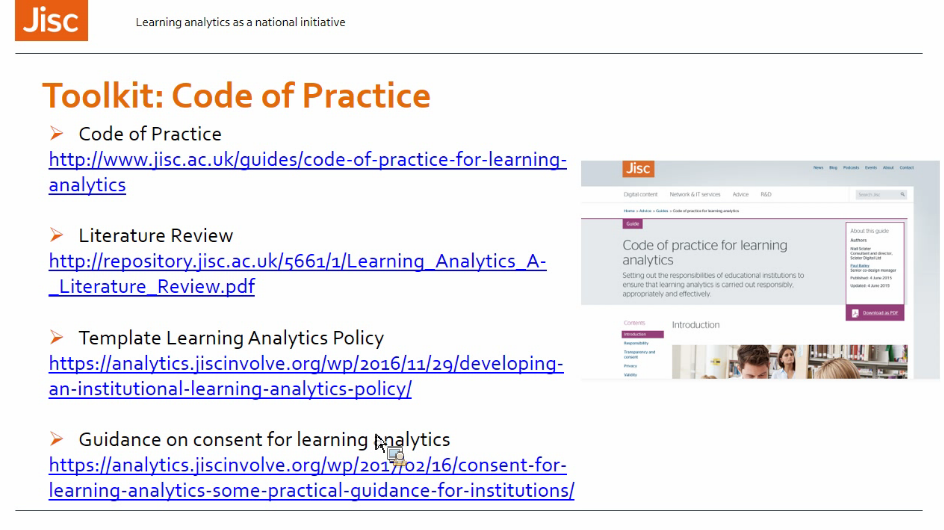
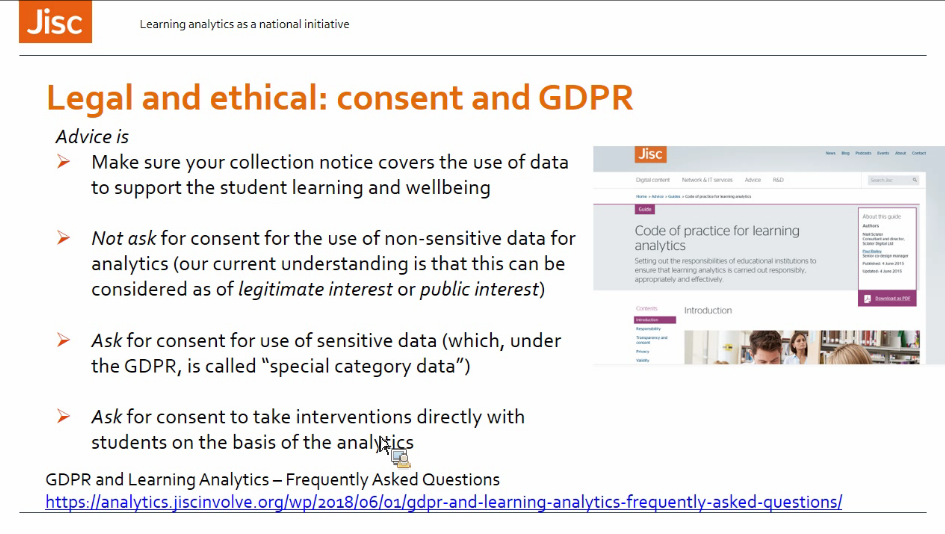
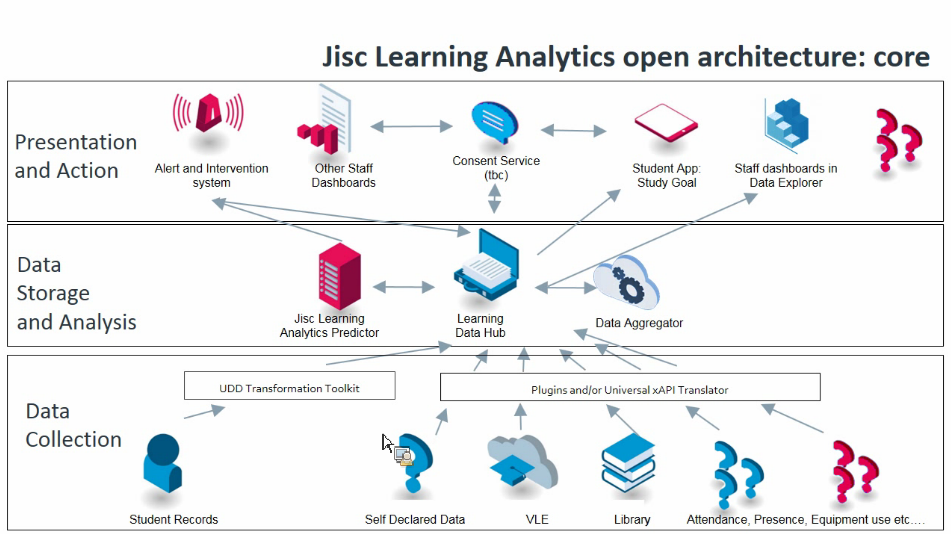
Learning analytics as a national initiative
/ Paul Bailey, JISC
- National initiative in the UK; national body taking initiative for the universities
- Now looking into learning analytics labs
- Codesign and collaboration. Concerns that the institutions had: should we do this at all. should we but this much money into it
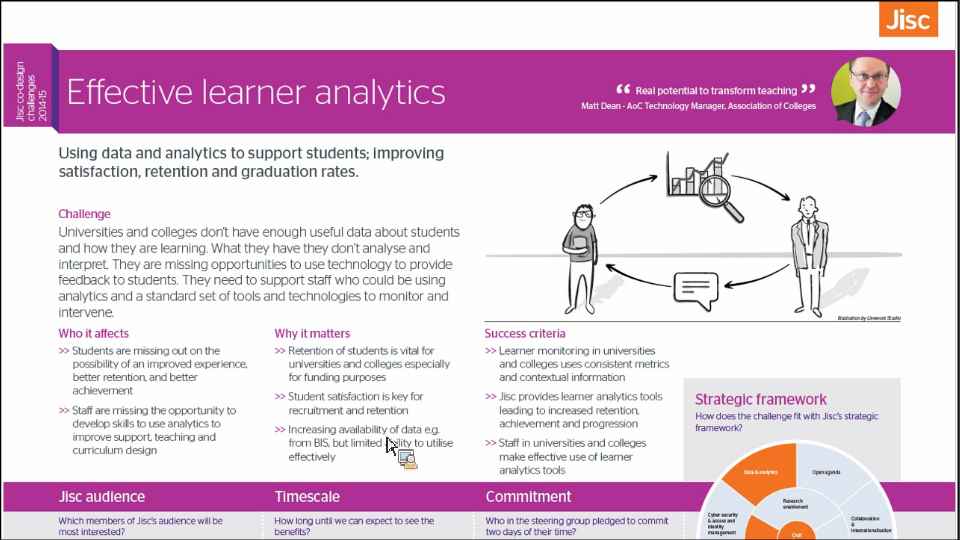
- Effective learner analytics
- Ethics and GDPR: (näihin kannattaa tutustua paremmin oppimisanalytiikan viitekehystä varten → linkkivinkit myös analytiikkaäly-hankkeelle)
- Open architecture:
- Future focus areas for JISC: employability
(tästä olisi kiva kuulla lisää IT-päivien esipäivän ohjelmaa ajatellen)
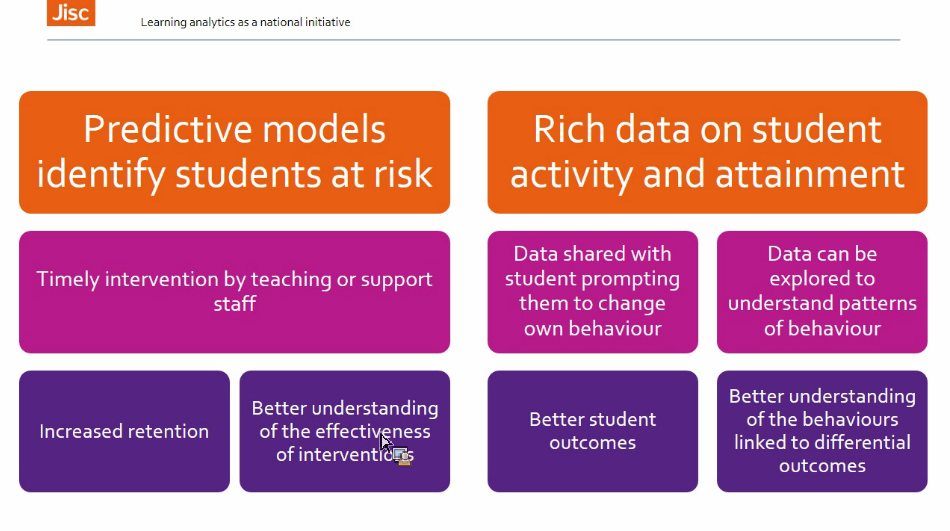
Screenshots of the presentation:
Effective learner analytics and challenges:

Lessons learned:
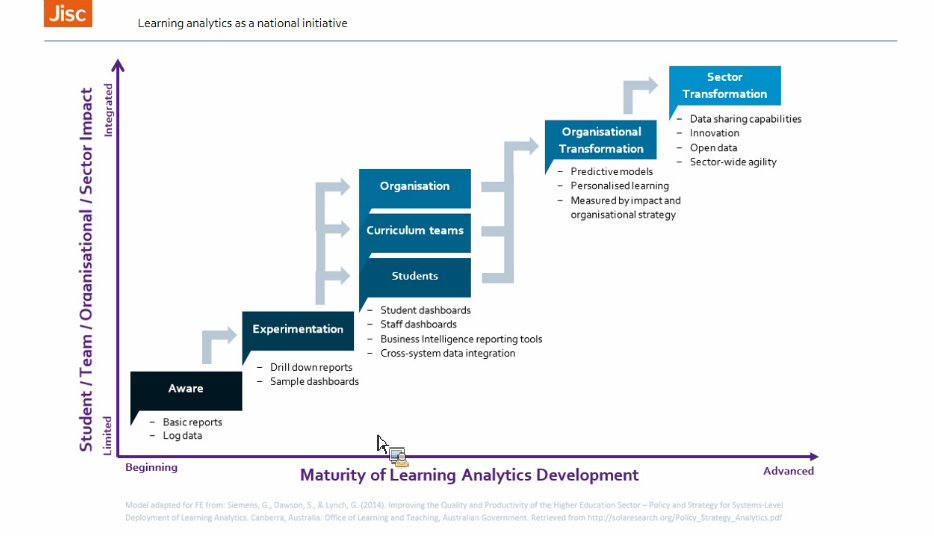

Process:

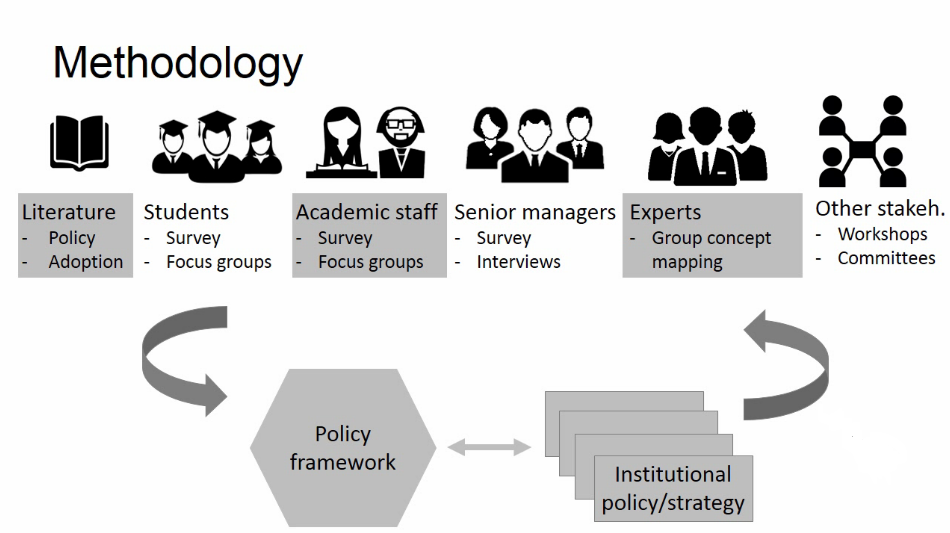
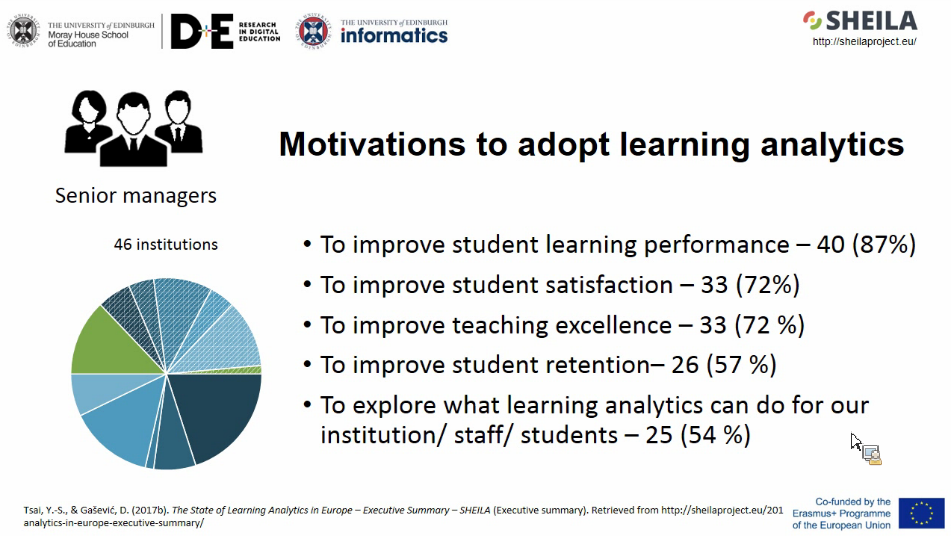
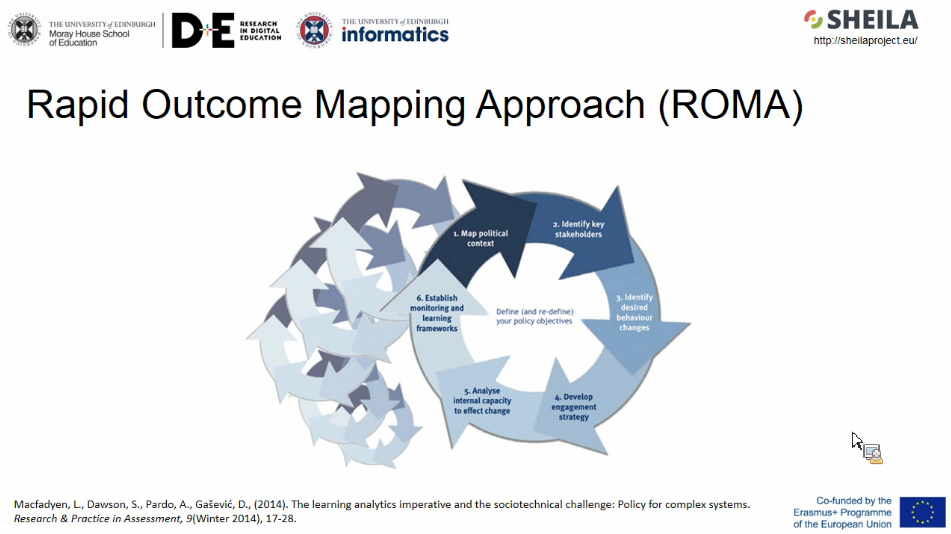
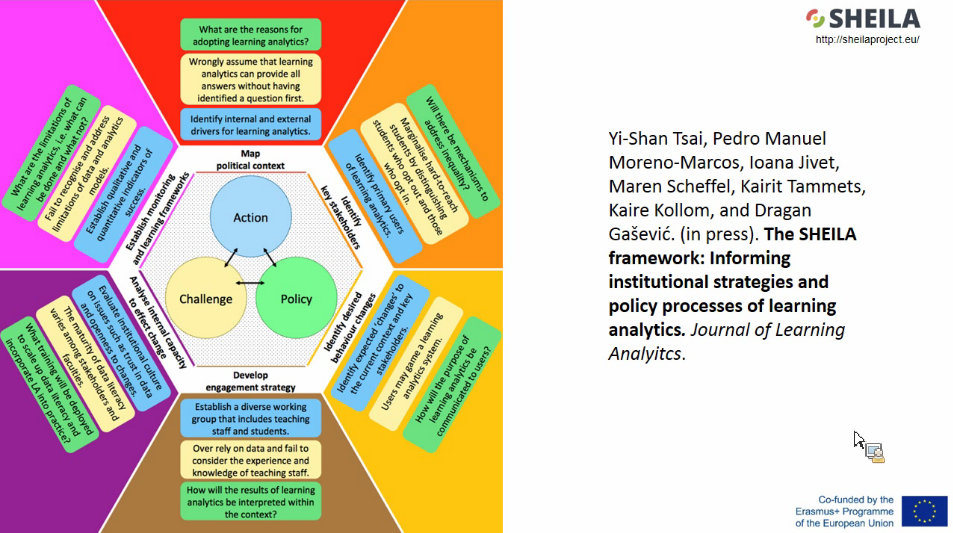
Developing learning analytics policy across Europe: the SHEILA project
/ Yi-Shan Tsai, University of Edinburgh
- SHEILA officially just ended
- SHEILA team consisted of various organizationd across Europe
- Starting point: hard to get data in a usable format. Aim to support the institutions to become more efficient custodians of the student data and to make student analytics ethical.
- Six key challenges identified:
- Shortage of key leadership
- Lack of training
- No or few policies existing
- Motivation factors of adopt learning analytics:
- Top concern of academic staff: is there time to do it at all (and is it necessary to do it..)
- Students concerned whether the use of data is ethical
- In the policy transparency and privacy deemed the most important
- SHEILA mooc coming (November 2018)
Screenshots of the presentation:
Framework is based on next model:
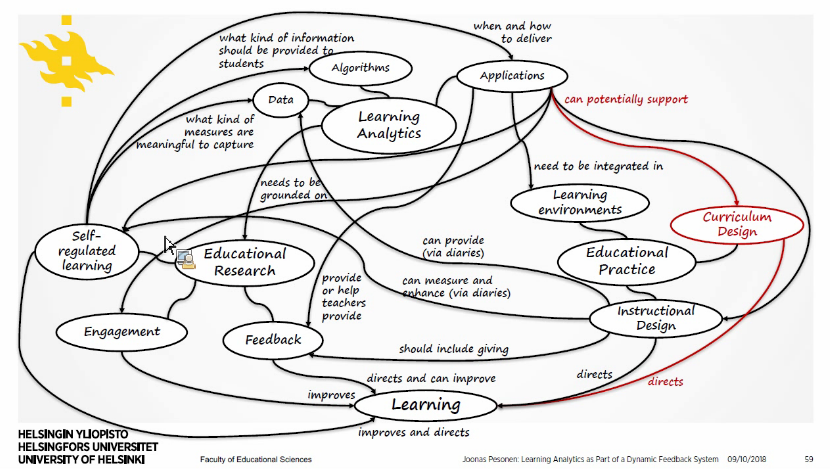
Learning analytics as part of a dynamic feedback system
/ Joonas Pesonen, University of Helsinki
- We should be critical about if learning analytics actually has positive effect on learning, there is no scientific results about the topic
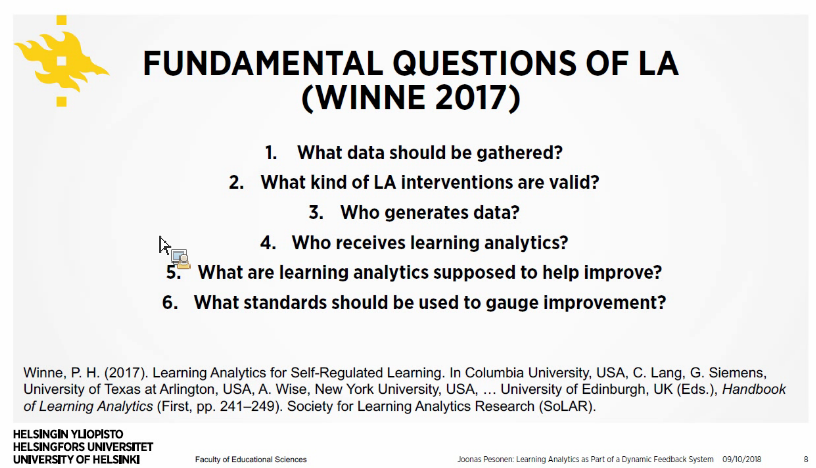
- There are many fundamental questions that should be taken into account when planning on using learning analytics
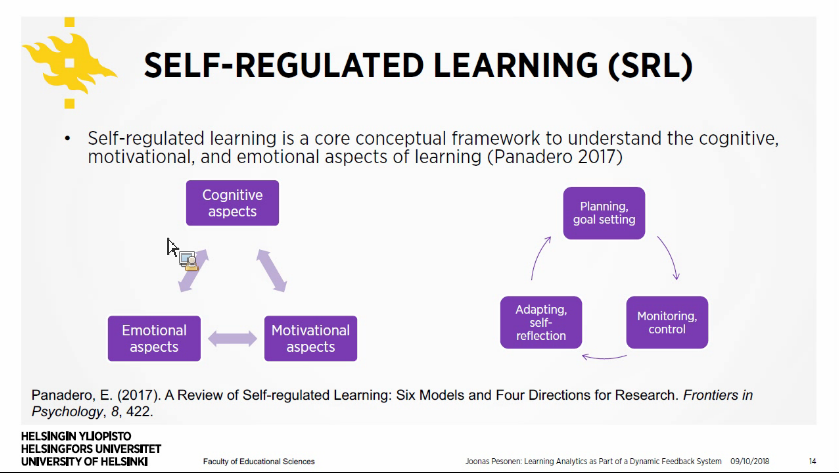
- Self-regulated learning are a core conceptual framework.
- Learning analytics dashboards as feedback → personalized feedback to students
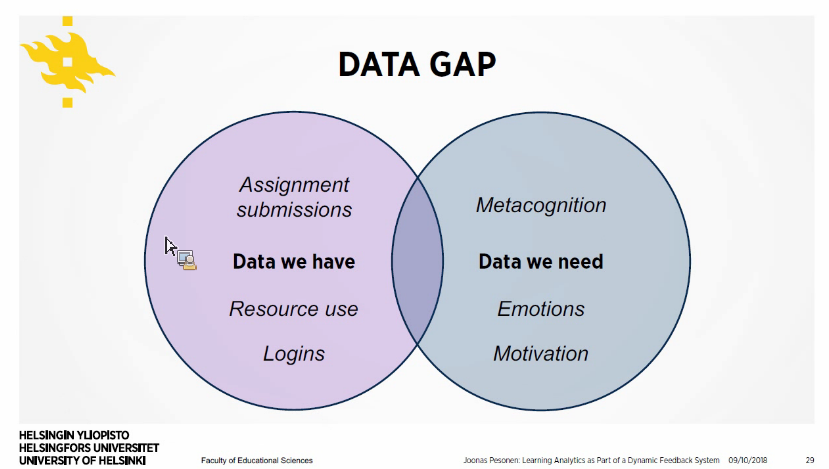
- Dynamic feedback systems:
- diaries (example of self-reported process data) & learning diaries capture also motivation and emotion in addition to cognition
- For teachers: data of the course, students feelings → possiblity to adapt during the course
- Linking learning analytics with curriculum design by connecting the data
The whole picture with links:
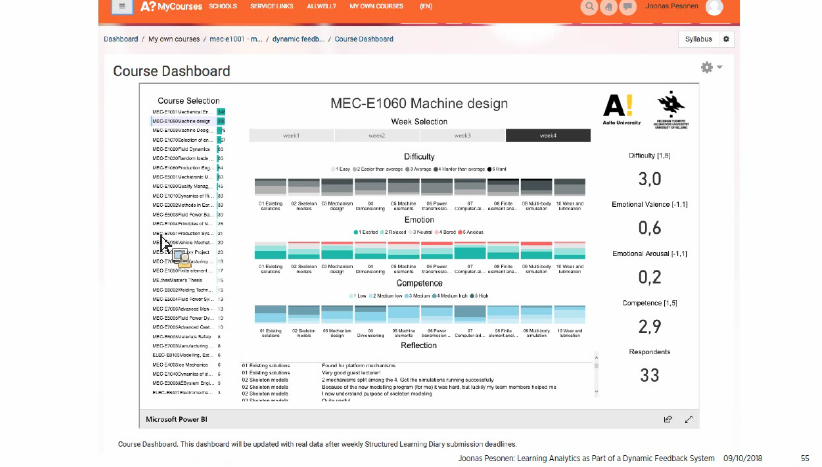
Screenshots of the presentation:
Dashboard for teachers (emotions & motivations):
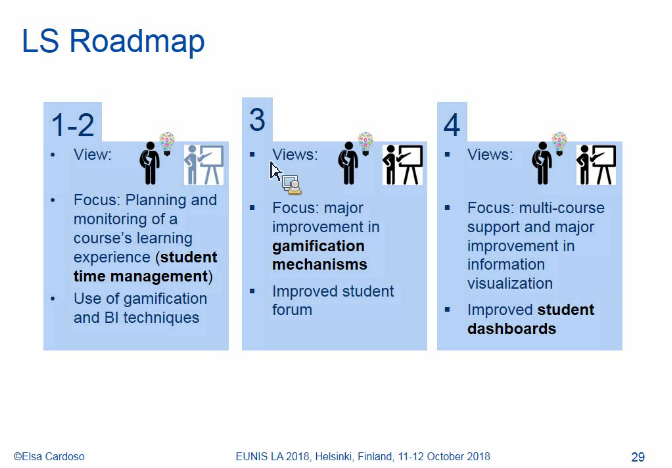
Learning analytics and gamification
/ Elsa Cardoso, University Institute Lisbon
Defining the learning analytics:
- Analytics should be tied to the decision making process in the organisation
- "Putting analytics to work is about improving performance in key business domain using data and analysis."
- In learning analytics BI and analytics techniques are applied to learners and their contexts
Gamification = the fun and engaging elements found in games applied to non-game contexts.
- Techniques used: XPs, Ranks, Quests, Events, Trophies, Badges, Avatars, Guilds, Leaderboards
Strategy map done with students:
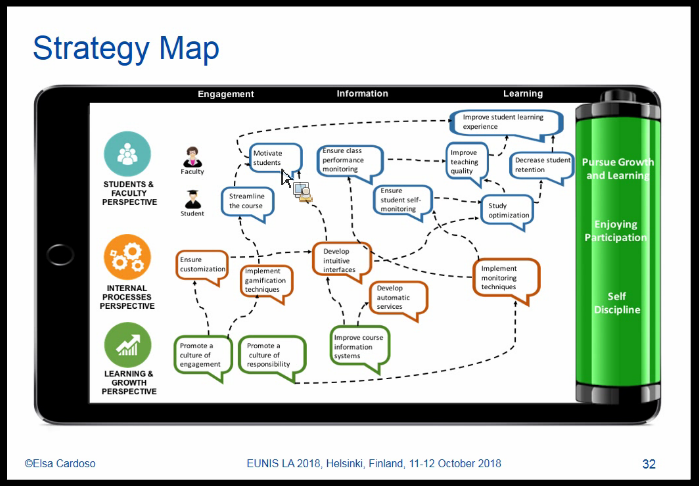
- Future:
Storyboard for students (road of trials)

Screenshots of the presentation:

→ tätä kannattanee verrata oppimisanalytiikan viitekehyksen pääkysymyksiin ja rakenteeseen

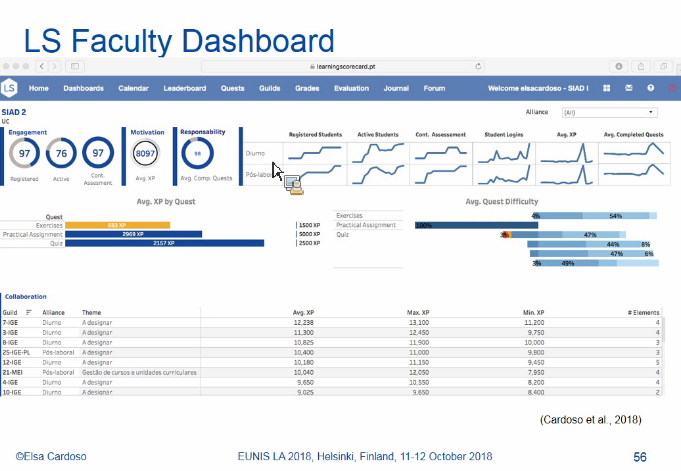
- student learning data, focus on: engagement, motivation. responsibility and collaboration
- monitoring of aggregated data
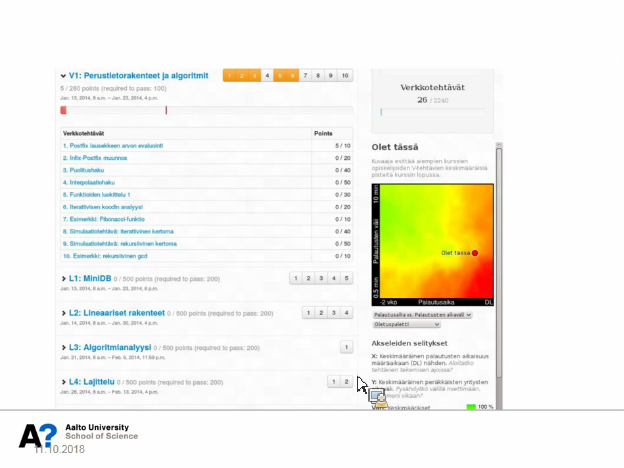
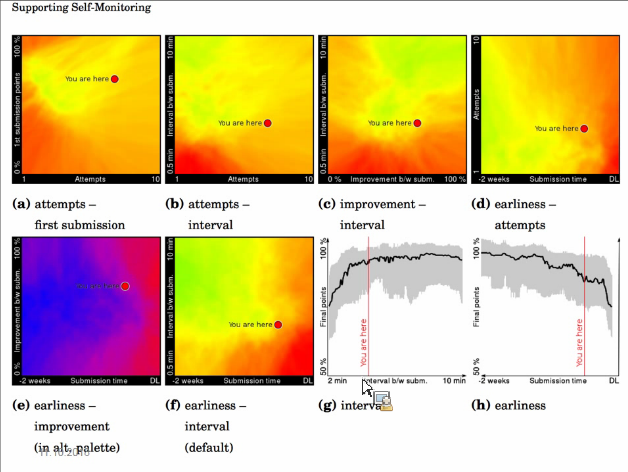
Using analytics to support development of better study habits
/ Lauri Malmi, Aalto
- Feeback needs to be timely. Challenges in processing feedback from massive courses.
- Assignments should really have impact on e.g. grade, for example 80% of the grade, and tests would be just to check that the person completed the assignments him/herself
- Gamification / visual progress feedback suports students with different motivation
(sama toimii myös opiskelijapalautteiden kanssa, jos opiskelija saa palautteestaan palautetta, vaikka sitten myöhemmin tiedon, että palautteella on vaikutusta tätän ja tähän, opiskelijoiden motivaatio antaa palautetta kasvaa) - Predictions based on your profile.
- Badges work well on performance orientated students. For performance-avoidance students neutral visualizations are better (heatmaps)
- Feedback on the study process
Screenshots of the presentation:
Tools for students to help self-monitoring (feedback, predictions and alarms):
Continous course improvement with learning analytics: Oulu Business School case study
/ Miska Noponen, Claned Group
- AI-powered learning environment
- Tracks the factors impacting learning thus helping learners to optimize their study motivation.
- One example: challenging students at beginning of the course, students will be more motivated, not so many dropouts.
Screenshots of the presentation:
- Activity map:
